Merced County’s unemployment rate is among California’s worst, data shows. See where it ranks
Despite the post-pandemic recovery, the county’s unemployment picture still faces challenges
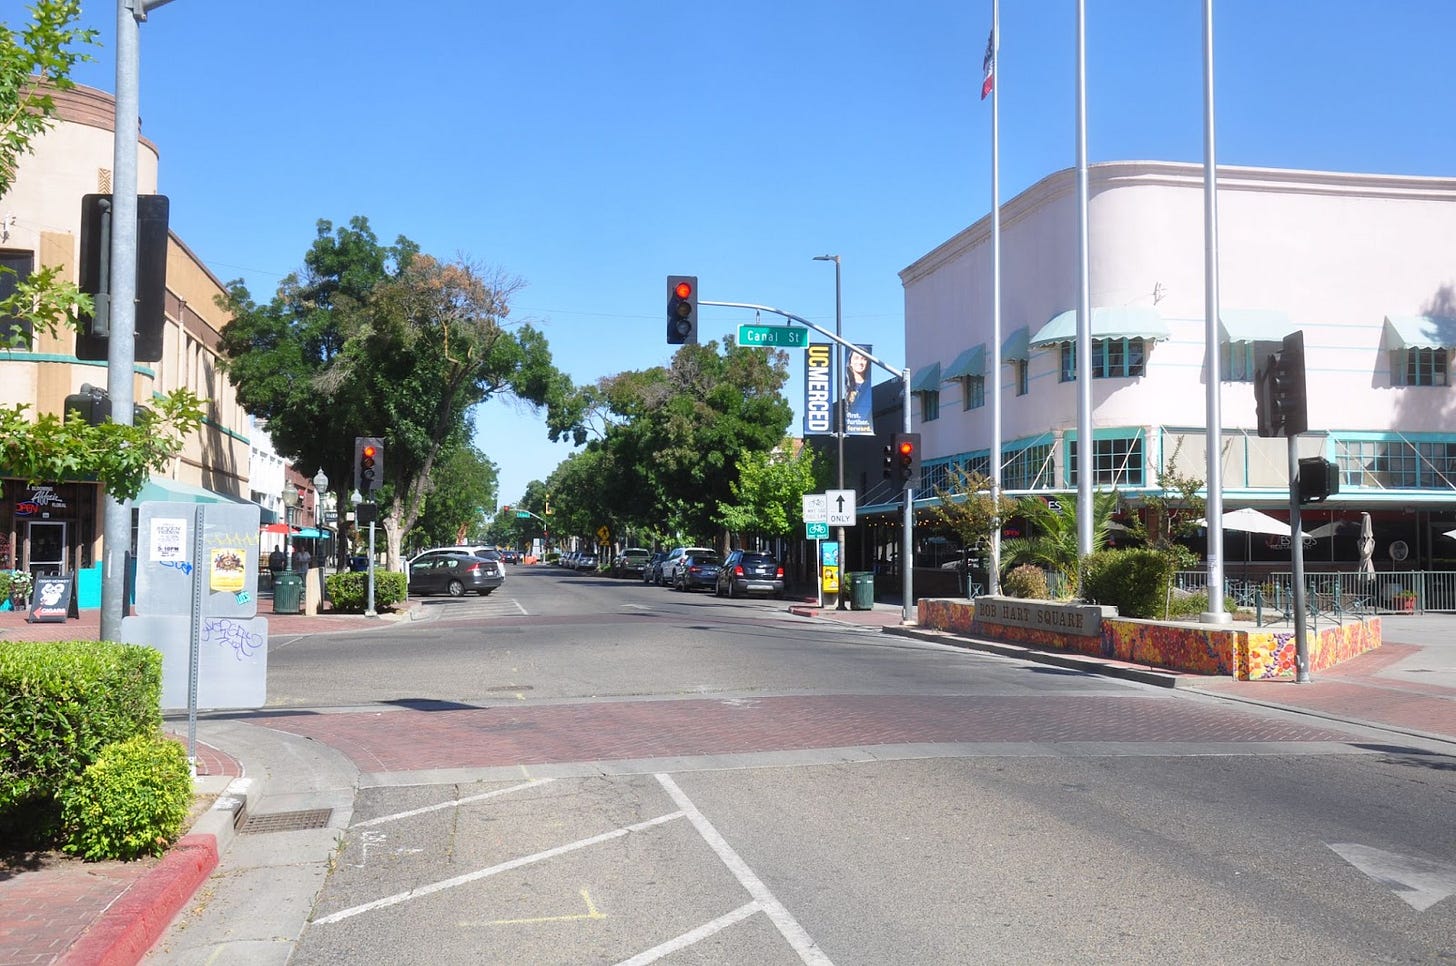
The view of Main Street looking east in downtown Merced is shown. CVJC Photo
By JOVI ZHAOZHOU DAI
zdai@publicintegrity.org
Despite gains made after the COVID pandemic, Merced County’s unemployment rate remains among the worst in California – and is now slightly higher in 2023 compared with a year ago, according to recent data released by California’s Employment Development Department (EDD).
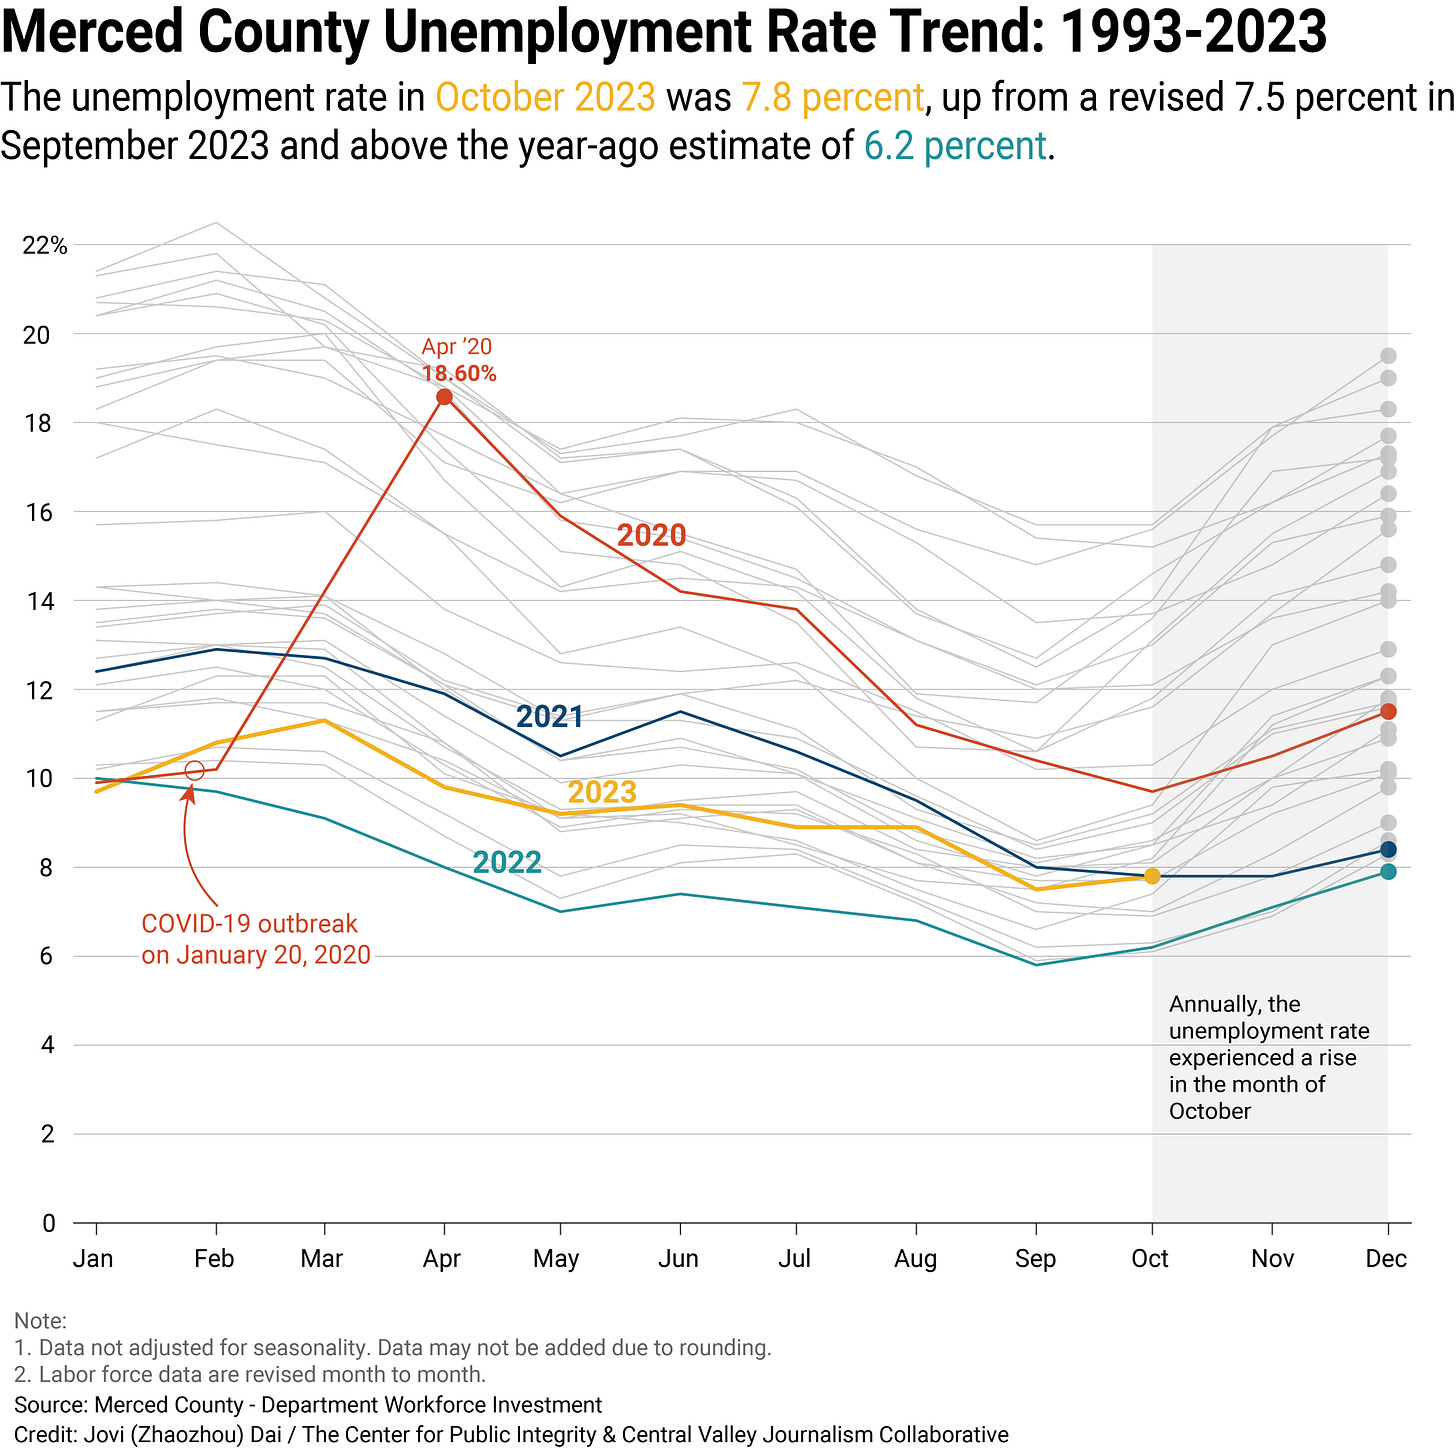
Merced County's unemployment rate rose to 7.8% in October 2023, up from the revised 7.5% in September and surpassing the year-ago estimate of 6.2%. Merced County’s unemployment rate at the start of 2023 was 9.7%.
In comparison, California reported an unadjusted rate of 4.80%, while the national rate stood at 3.6% during the same period in October.
Among California’s 58 counties, Merced County ranks fourth-highest in the state for unemployment, based on Oct. 2023 numbers.
San Mateo County in the Bay Area ranks first in the state for percentage of employed workers, with the state’s lowest unemployment rate at 3.20%.
Merced isn’t the only San Joaquin Valley county that ranks high on the unemployment list. Tulare County ranks second with an unemployment rate of 9.6%. Kern County ranks fifth, with an unemployment rate of 7.5%.
Editor’s Note: Click here to see where all California counties rank
Thomas Pogue, executive director of the Center for Business and Policy Research at the University of Pacific, said Merced County’s month-to-month changes in unemployment in 2023 are similar to last year.
The Center for Business and Policy Research at the University of Pacific is a regional economic development center focused on socioeconomic and environmental development across northern California.
Pogue said the size of Merced County’s labor force has also stayed pretty close to the same size for 2023 compared with the prior year, although it started to shrink in the last couple of months from what he's seen.
Pogue didn’t pinpoint a singular reason behind Merced County’s status on the unemployment list, but did say challenges with the weather and impacts on crops can play a role in Valley counties like Merced.
Steven Gutierrez, an EDD labor market researcher, said the months of August, September and October typically reflect the lowest unemployment rate each year not only in Merced County, but in the San Joaquin Valley in general.
That’s because of the seasonal swings in agriculture, employment and school starting up in the fall. For example, when the fruits and vegetables are being picked, that’s typically the high point of the year for employment.
"And then usually in the fall and winter, you normally have an uptick in regards to the unemployment rate, because a lot of unemployment is (related to agriculture) and you have declining employment in farm work and manufacturing,” Gutierrez explained.
In October 2022, Merced County’s civilian labor force stood at 117,200 individuals, with 109,900 employed and 7,300 classified as unemployed. In October 2023, Merced County's civilian labor force was 114,800 individuals, with 105,800 employed and 9,000 unemployed.
Those changes in key metrics are marginal, as the civilian labor force increased by 0.10%, while civilian employment decreased by -0.30% in 2023.
Impact following COVID pandemic
Although Merced County trails much of the state in employment, the numbers still show a dramatic rebound in the years following the COVID pandemic.
In 2020, just before the onset of the COVID-19 pandemic, the year began with a relatively moderate unemployment rate of 9.9% in January. But unemployment rates surged as the pandemic unfolded, reaching a staggering peak of 18.6% by April 2020.
Back then, the unemployment picture was similarly bleak both statewide and nationally. From 2019 to 2020, the Bureau of Labor Statistics reported a significant unemployment rate surge across the U.S. and California, peaking at 14.7% and 16.1%, respectively.
The unprecedented challenges posed by the pandemic resulted in economic disruptions, job losses and heightened uncertainty, contributing to the significant spike in unemployment during this period.
In 2021, the county continued to grapple with the pandemic. Although the unemployment rate slightly improved compared to 2020, it remained elevated throughout the year's first half. The rates fluctuated between 10.5% in May and 10.6% in July, indicating a slow recovery and lingering economic challenges.
By 2022, signs of recovery became more apparent, with a notable decline in unemployment rates. January 2022 started at 10%, and by December, the rate had decreased to 7.9%.
This positive trend suggests that the county's economy was gradually rebounding, reflecting a broader regional and national recovery from the impacts of COVID.
The positive momentum continued into 2023, as reflected in the unemployment rates for the year's first three months. January started with a rate of 9.7%; by March, it had decreased slightly to 9.2%.
Looking at statewide employment
In 2023, California's labor force demonstrated diverse economic activities across its counties, contributing to the state's overall employment landscape.
EDD’s statewide analysis reveals a total labor force of 19.4 million people, with 18.4 million individuals employed, resulting in an unemployment rate of 4.80%. This figure serves as a benchmark against which individual counties can be compared.
Imperial County, which has California’s highest unemployment rate at 19.30%, has a labor force of 74,600 people, of which only 60,200 individuals were employed, leaving a staggering 14,400 people unemployed.
Merced County, which has an unemployment rate of 7.8%, has a labor force of 114,800 as of October 2023, with 105,800 individuals employed, leaving 9,000 unemployed.
Among counties that surpass the state unemployment average of 4.80%., San Mateo County demonstrated a remarkable unemployment rate of 3.20%, showcasing a robust local job market. That county lists 14,500 as unemployed.
Similarly, Napa County (3.50%) and San Francisco County (3.40%) boasted lower unemployment rates than the state average, as did Marin (3.60%) and Santa Clara (3.80%).
Regional patterns also emerge, with Southern California counties like Riverside (5.20%) and San Bernardino (5.00%) experiencing moderate unemployment rates.
Pogue said across the board statewide and nationally there is a need to create higher value, better-paying jobs “that allows people to house themselves, feed themselves, take care of their kids (and) look towards retirement pay for their health care."
Meanwhile, in California, while some urban areas have very well-paying jobs, there remains a scarcity of housing statewide. "That's putting a lot of cost pressure on the workers, who don't necessarily have the training to access those higher paying jobs," he said.
Pogue said for employers in the state, as the cost of paying their workers goes up, it “also puts challenges on their profits and their ability to do business in California."
Zhaozhou Dai is a data reporter with The Center for Public Integrity in collaboration with the Central Valley Journalism Collaborative.
Editor’s Notes: Click here for an interactive example of this chart


